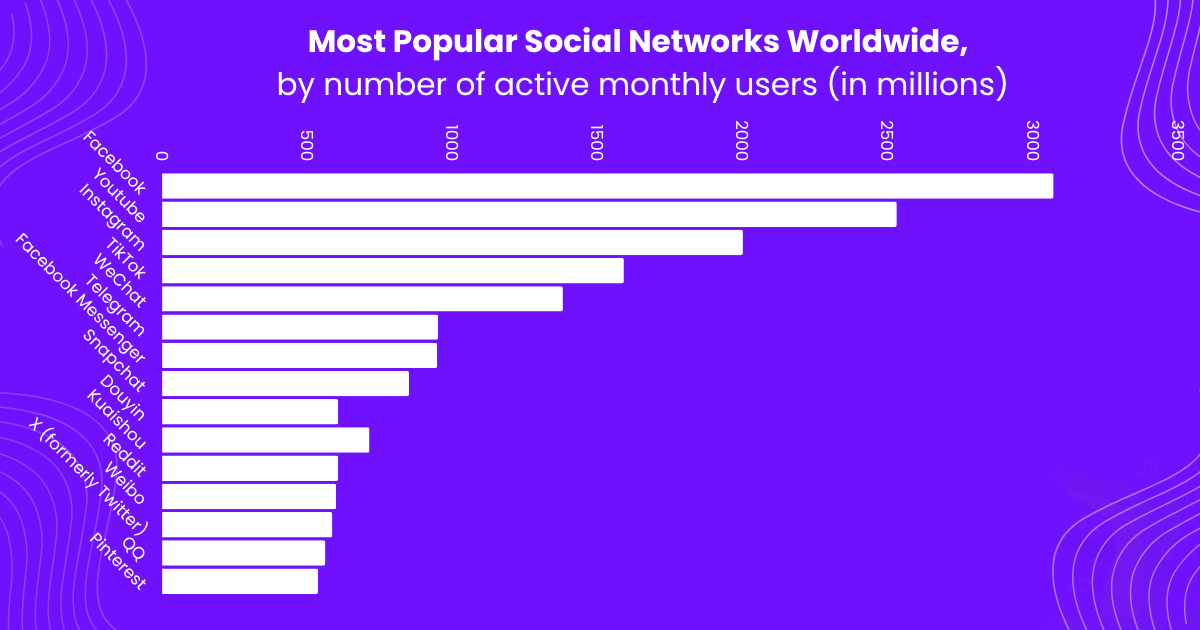
With more than three billion monthly active users, Facebook remains the most popular social network in the world. Despite newer platforms making waves, Facebook continues to serve as an essential channel for both personal connections and business growth. For marketers, understanding Facebook’s evolving user base, engagement trends, and ad performance can help shape smarter digital strategies.
At ShortifyMe, we work with brands that rely on platforms like Facebook to drive measurable results through smarter link tracking and QR code engagement. If you’re looking to better connect your campaigns across social media, explore how our Facebook link shortener can help simplify your marketing efforts.
General Facebook Statistics
As of 2025, Facebook hosts more than three billion monthly active users, securing its title as the most popular social platform in the world. The platform’s website, Facebook.com, ranks as the third-most visited site globally, trailing only behind Google and YouTube. This consistent traffic volume highlights Facebook’s continued relevance across generations.
That reach also makes it an attractive advertising powerhouse. In 2024, Facebook generated $164.5 billion in ad revenue, a significant increase from $134 billion the year before. Yet, maintaining this scale also means addressing challenges, as Facebook removed over 1.1 billion fake accounts in Q3 2024, demonstrating ongoing efforts to preserve authenticity and user trust.
Even with so much global activity, certain pages continue to stand out. The NBC Olympics & Paralympics page was the most widely viewed Facebook page in the U.S. during Q3 2024, showcasing how event-driven and entertainment content continue to capture massive attention.
These numbers show how Facebook is a platform that’s both powerful and constantly evolving, and one that marketers shouldn’t overlook.
For businesses and marketers looking to make these insights actionable, ShortifyMe offers linking tools that simplify tracking engagement across Facebook campaigns. By using custom short links and QR codes, brands can better measure clicks, monitor user interaction, and optimize performance for higher ROI.
Facebook Benchmark Statistics
Facebook holds a unique place in social media history as the first network to surpass one billion registered accounts, and it’s continued to grow to more than three billion active users. Their parent company, Meta Platforms, also oversees three other major platforms, including Instagram, WhatsApp, and Facebook Messenger, each surpassing one billion users of their own. Together, they form a digital ecosystem that touches nearly half of the planet’s online population.
In March 2025, Facebook accounted for 56 percent of all social media site visits in the United States, securing its role as the country’s most dominant social site by far. This level of engagement reinforces why marketers continue to view Facebook as a foundational piece of their digital strategy.
While competition for attention is fiercer than ever, Facebook’s reach and integration across Meta’s family of apps make it a critical player in the global marketing landscape.
Facebook Usage Statistics
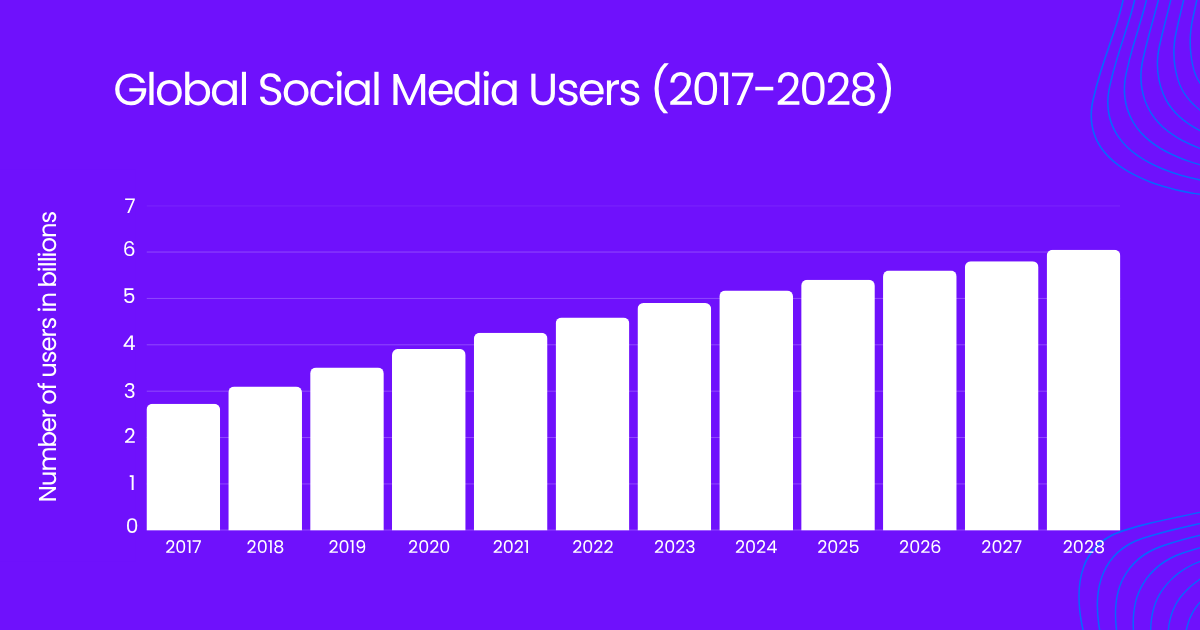
The way users spend time on social platforms continues to shift. Between 2012 and 2024, average daily social media usage increased steadily, peaking at 151 minutes per day in 2023 before easing slightly to 143 minutes in 2024. Although Facebook remains a key player, younger generations are gravitating toward video-first platforms like TikTok, YouTube, and Snapchat.
That shift is reflected in Facebook’s demographics. The platform is most popular among older audiences, with its largest U.S. user group aged 25 to 34. While Gen Z may be exploring newer platforms, Facebook remains a core destination for Millennials and Gen X users who have integrated it into their daily lives for both personal and professional communication.
This ongoing generational divide offers an important reminder to marketers: each platform plays a unique role in a diversified social strategy.
Facebook Users by Country
Facebook’s user base spans nearly every part of the world, but some regions stand out. India leads with 383.5 million active users, followed by the United States with 196.9 million, and Indonesia with 123.4 million. Other top markets include Brazil (111.65 million), Mexico (92.95 million), and the Philippines (90.75 million).
Further down the list, Vietnam (76.2 million), Bangladesh (59.95 million), Thailand (50.95 million), Egypt (48.65 million), and Pakistan (45.4 million) represent key emerging regions. Meanwhile, Western markets like the United Kingdom (38.3 million), France (31.45 million), and Italy (28.2 million) still maintain strong presences.
These global numbers highlight Facebook’s universal reach and its continued importance for international marketing efforts. Even as other apps gain ground in specific regions, Facebook remains a unifying social platform worldwide.
| Country | Facebook Users (million) |
|---|---|
| India | 383.5 |
| United States | 196.9 |
| Indonesia | 123.4 |
| Brazil | 111.65 |
| Mexico | 92.95 |
| Philippines | 90.75 |
| Vietnam | 76.2 |
| Bangladesh | 59.95 |
| Thailand | 50.95 |
| Egypt | 48.65 |
| Pakistan | 45.4 |
| Nigeria | 38.65 |
| United Kingdom | 38.3 |
| Colombia | 36.8 |
| Turkey | 34.8 |
| France | 31.45 |
| Argentina | 29.05 |
| Italy | 28.2 |
| South Africa | 26.7 |
| Algeria | 25.55 |
Source: Statista
Facebook Usage by Device
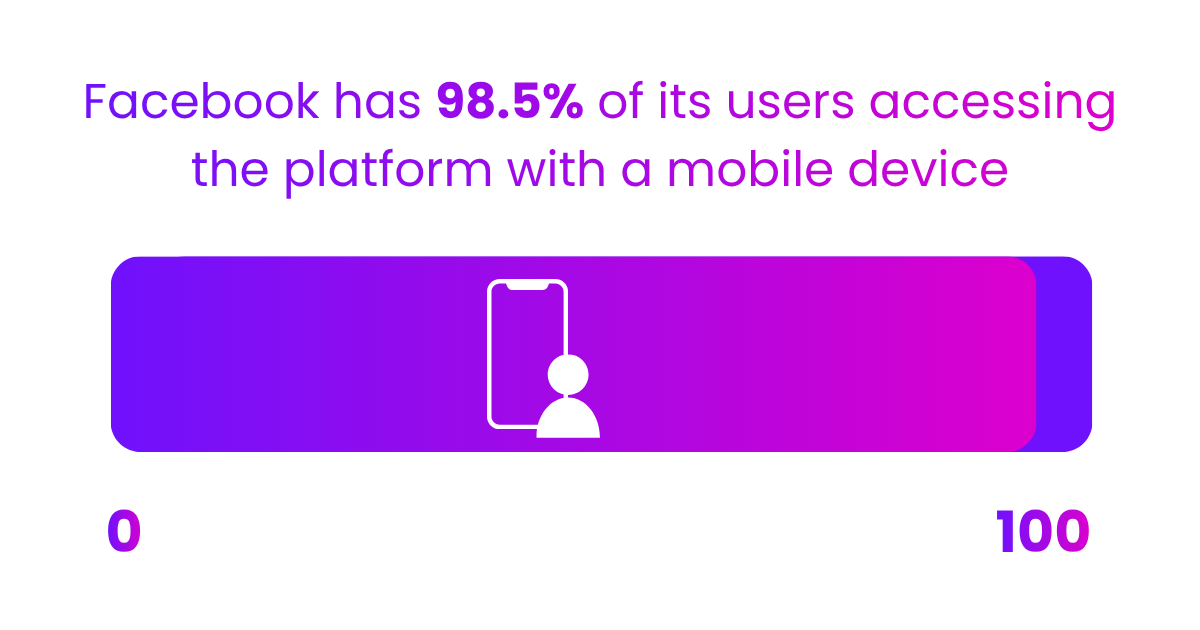
The majority of Facebook’s users engage on the go. As of mid-2021, 98.5 percent of active users accessed the platform from mobile devices, and an impressive 81.8 percent did so exclusively through mobile phones.
Meta has supported this mobile-first approach through dedicated apps for Facebook, Messenger, and other services, helping ensure that users can connect anywhere, anytime. For marketers, this trend shows the importance of optimizing ad creative and landing pages for smaller screens. Mobile is no longer just a touchpoint, as it’s the default experience for nearly everyone.
Facebook Revenue Statistics
Financially, Facebook’s parent company, Meta Platforms, continues to deliver significant growth. In 2024, Meta generated more than $164 billion in total revenue, primarily driven by advertising. That marks a substantial increase from $134 billion in the prior year.
Meta’s earnings before income taxes (EBIT) reached $70 billion in 2024, up from $47 billion in 2023, an increase of roughly $23 billion year over year. These results reflect both Facebook’s continued advertising dominance and Meta’s expanding role in shaping digital ecosystems.
The financial trajectory makes it clear that businesses still view Facebook as an essential platform for brand visibility and conversion opportunities.
Facebook Advertising Statistics
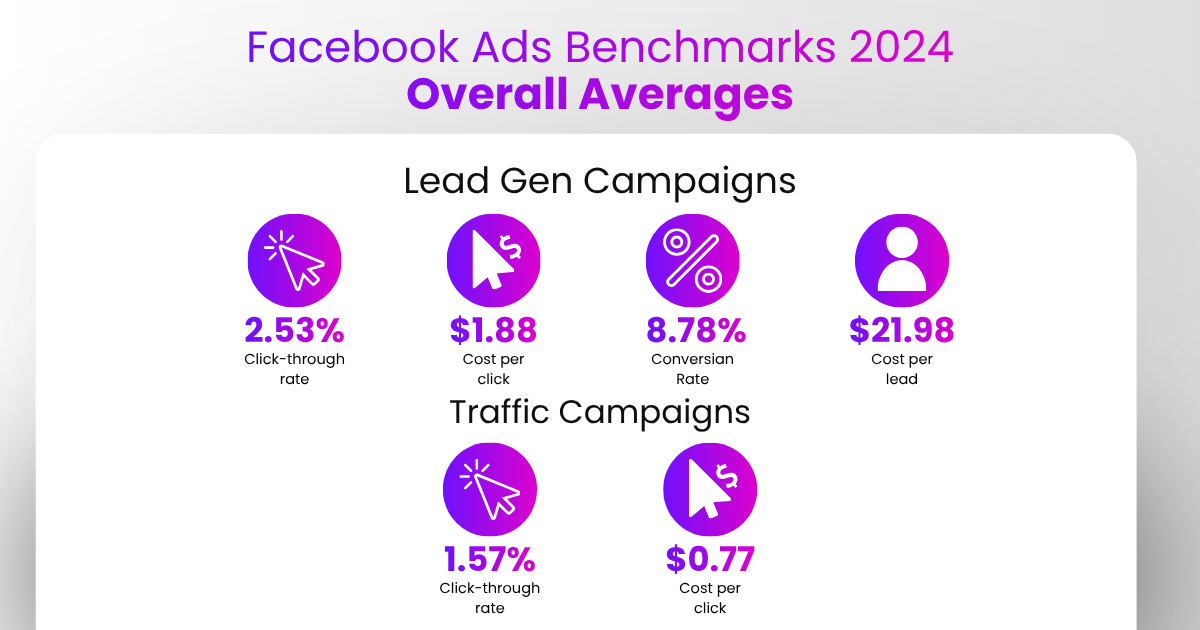
Facebook advertising remains one of the most effective digital channels available. The average click-through rate (CTR) across industries sits at 2.53 percent, while traffic campaigns cost about $0.77 per click. The average conversion rate on Facebook is an impressive 8.78 percent, placing it among the top three ROI drivers for marketers globally.
Video continues to outperform other formats. Vertical Facebook ads with speech or voiceover achieve 3 percent higher conversion per dollar compared to non-video formats. This data suggests that clear, engaging creative is key to capturing audience attention and driving results.
These numbers show why advertisers continue to invest heavily in Facebook campaigns, as the data still supports their value.
Facebook Engagement Statistics
Engagement levels of Facebook provide insight into how users interact with brand content. As of November 2024, the average engagement rate for page posts was 0.05 percent, showing that while reach remains vast, meaningful interactions require thoughtful content strategies.
Image posts see the highest engagement, averaging 0.07 percent, while link posts have the lowest at 0.02 percent. These figures illustrate that visual storytelling continues to perform best, even as attention spans shrink.
For brands, this means engagement isn’t just about being present, but about posting content that resonates with their audience. The right balance of imagery, storytelling, and timing can help transform impressions into genuine connections.
The Takeaway for Your Social Strategy
Despite the evolving social media landscape, Facebook remains a cornerstone of digital marketing. Its massive global reach, deep ad ecosystem, and mobile-first audience make it a platform that continues to deliver measurable business results. For marketers, understanding how people use Facebook and how to connect through meaningful, trackable content is essential to staying relevant.
Ready to start tracking and optimizing your own links across social platforms? Sign up for ShortifyMe and make every click count.